 /home/hgs/www/4me/ag-superc/scg-cal-merged-O.ph02.png
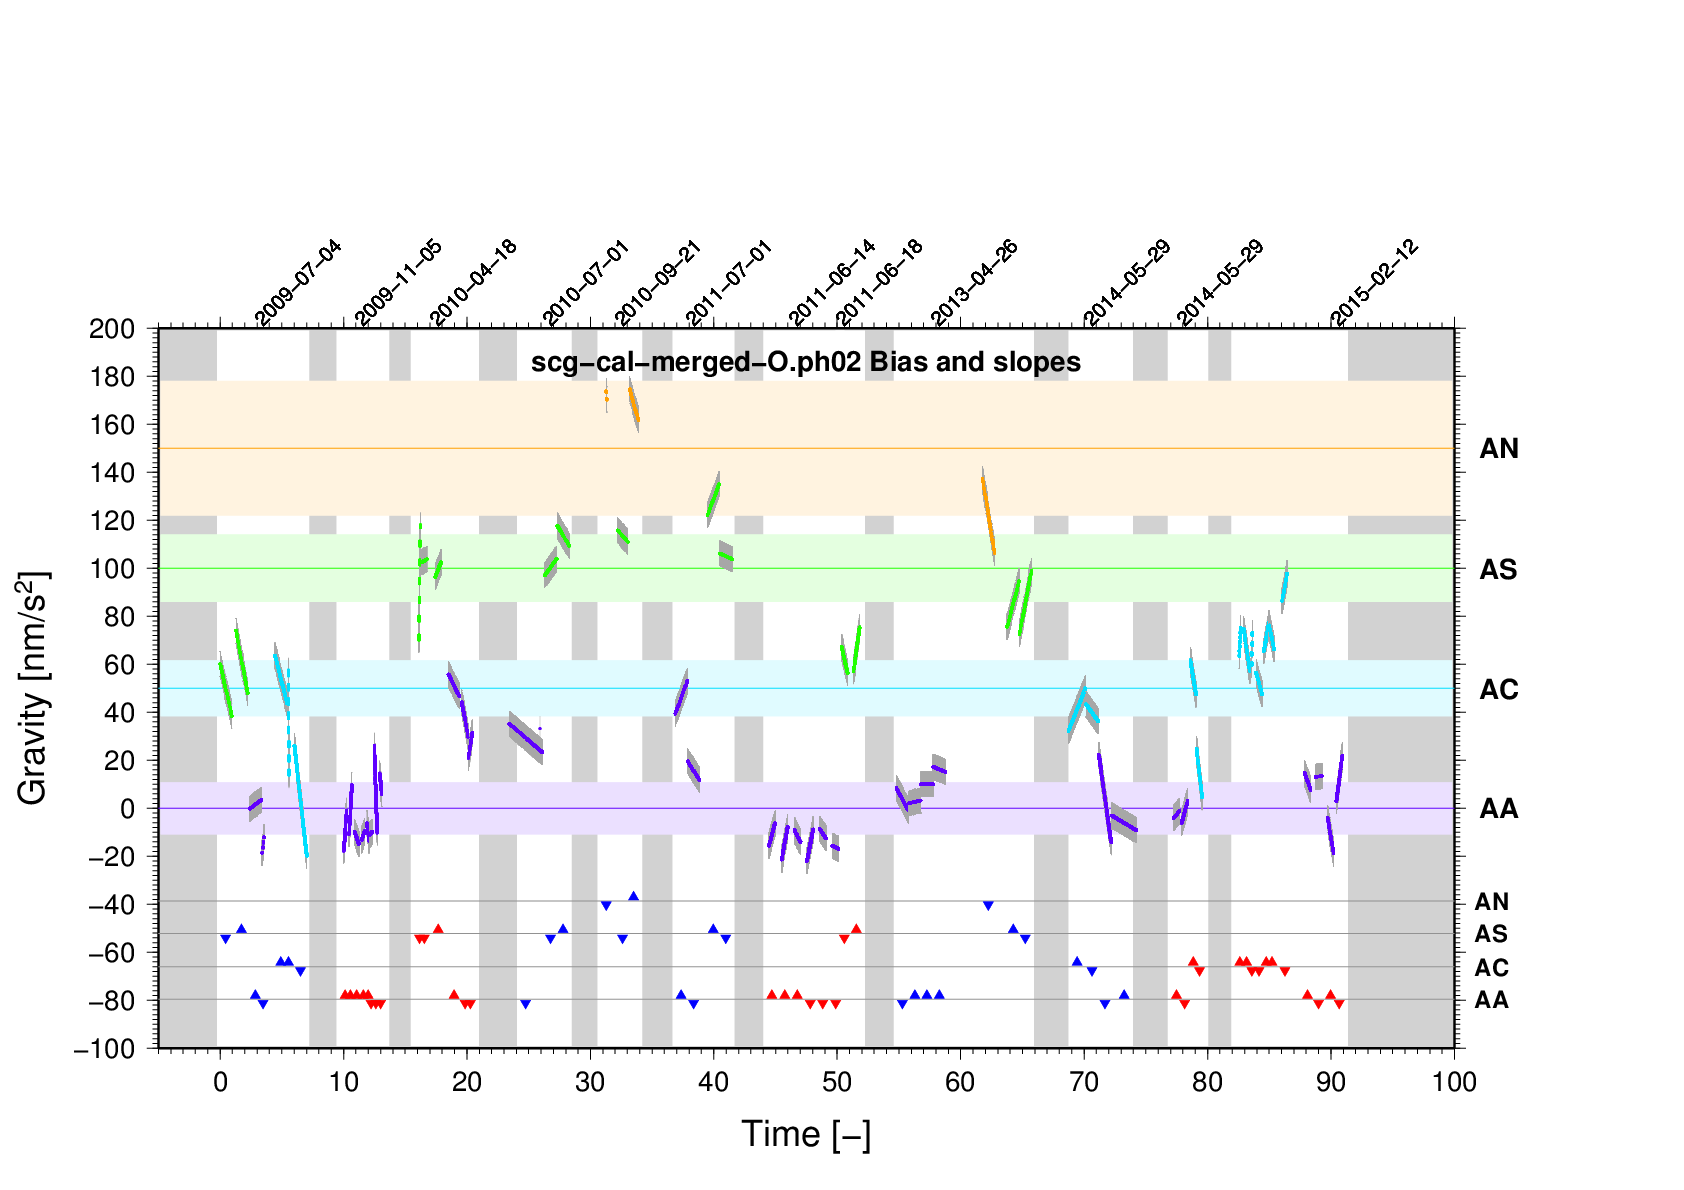
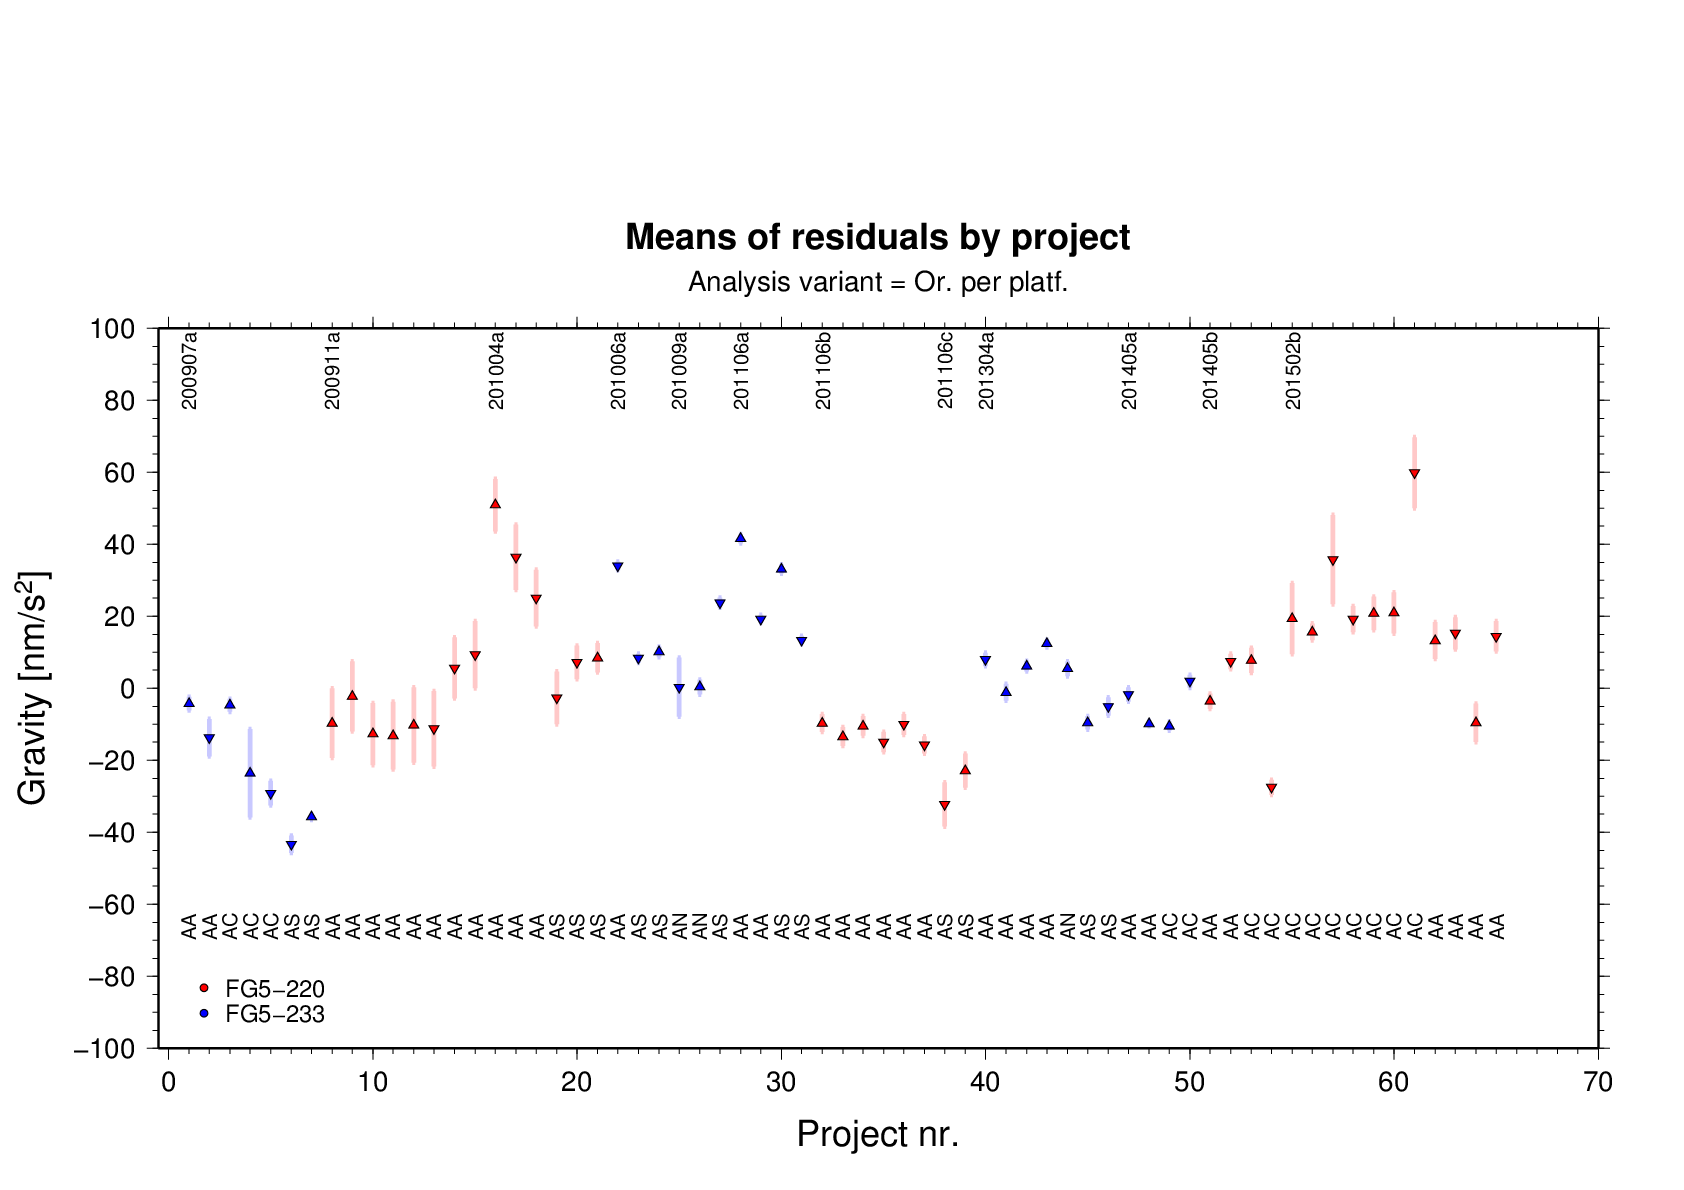
Plot shows deviations of measurements for each platform. Platform
value is only symbolic (offset for visibility), deviations in nm/s^2
The uncertainty of the platform value is 95% confidence
Deviation is A + B + C
with
A: estimated mean value from all measurements by any instrument in
any orientation
B: estimated slope for each project (uncertainty not shown)
C: average DC-value of super-campaign residual during the specific
project
The birds-on-the-wire in the bottom half show what instrument (blue:
233, orange 220)
in what orientation (north = triangle pointing up, south down) and
platform.
 /home/hgs/www/4me/ag-superc/scg-cal-merged-O.ra.png
 /home/hgs/www/4me/ag-superc/scg-cal-merged-x.ra.png
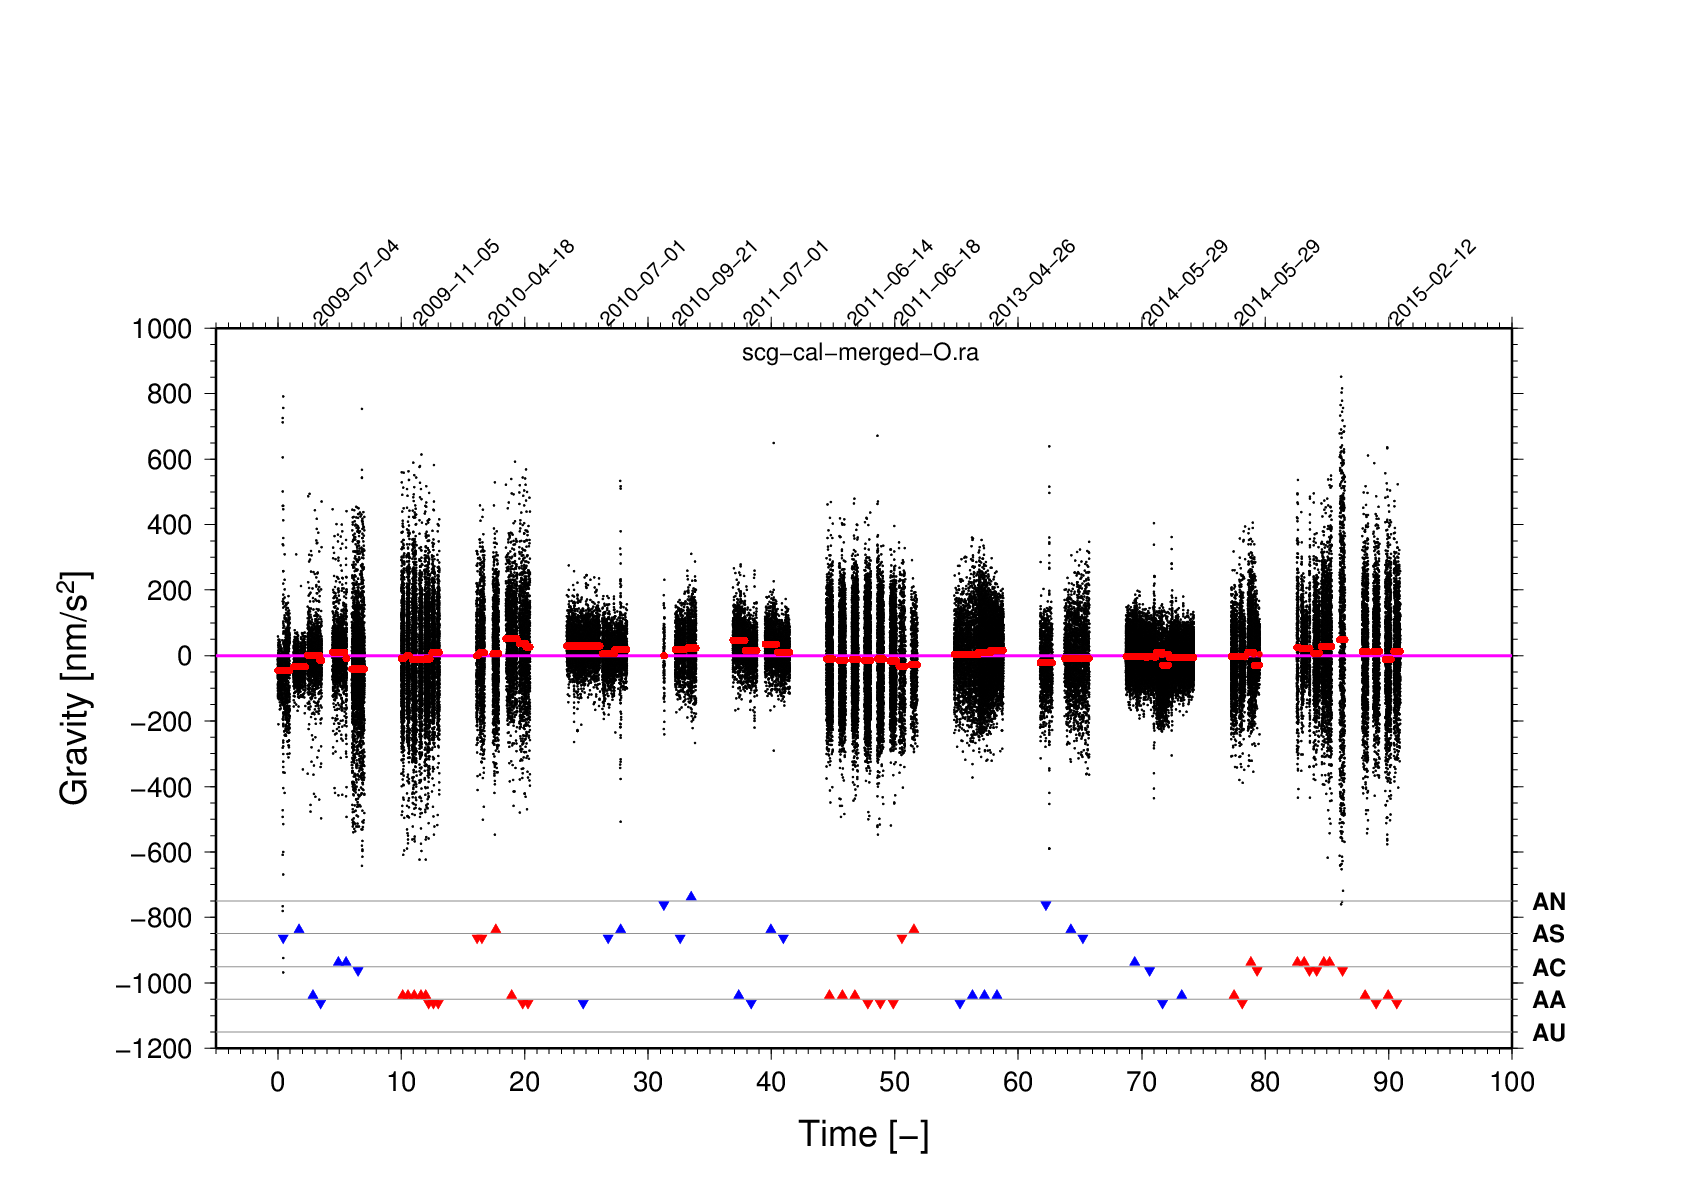
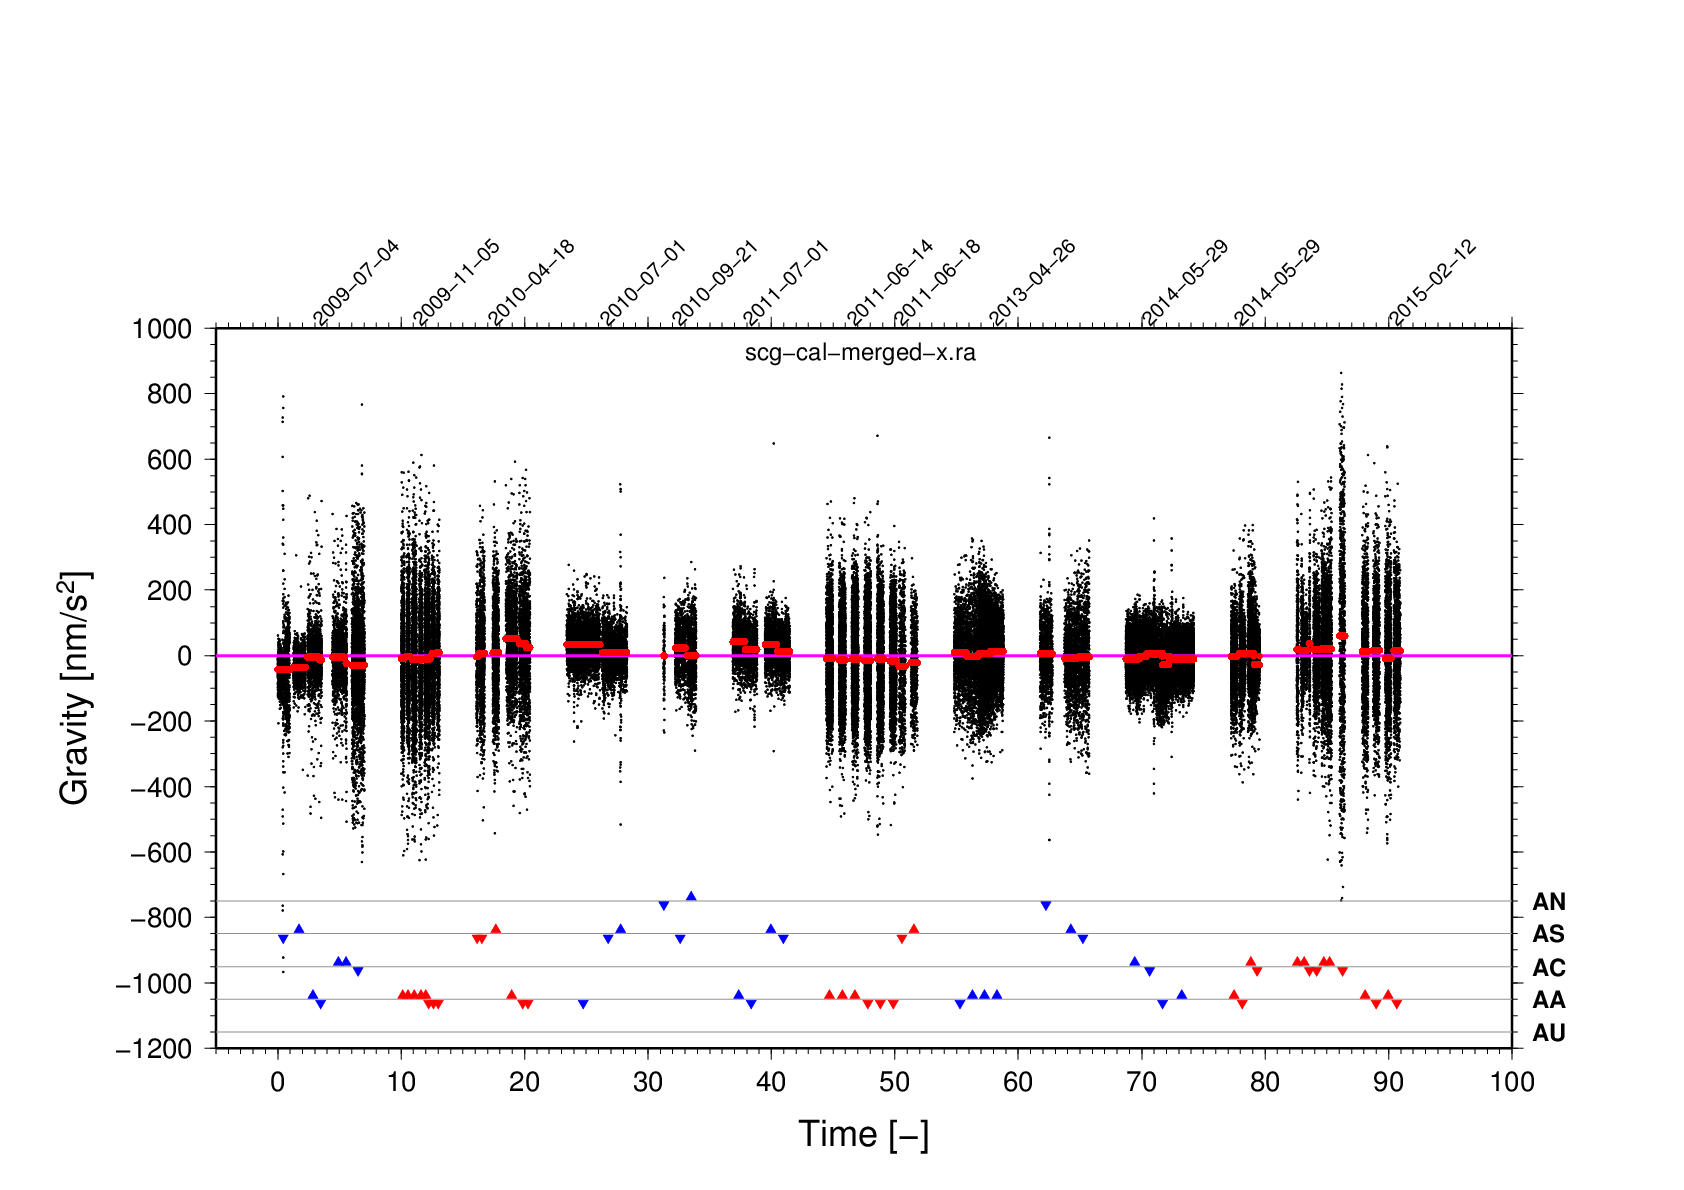
The two figures above.
Drop scatter and DC-offset in each project.
File name with "-O": The orientation-related offset is attached to
the instrument and assumed constant during all the years.
With -x: O-offset is attached to each platform (unrealistc, but an
alternative to see the impact of lowering the constraints).
 /home/hgs/www/4me/ag-superc/tp-tbl-O.png
 /home/hgs/www/4me/ag-superc/tp-tbl-x.png
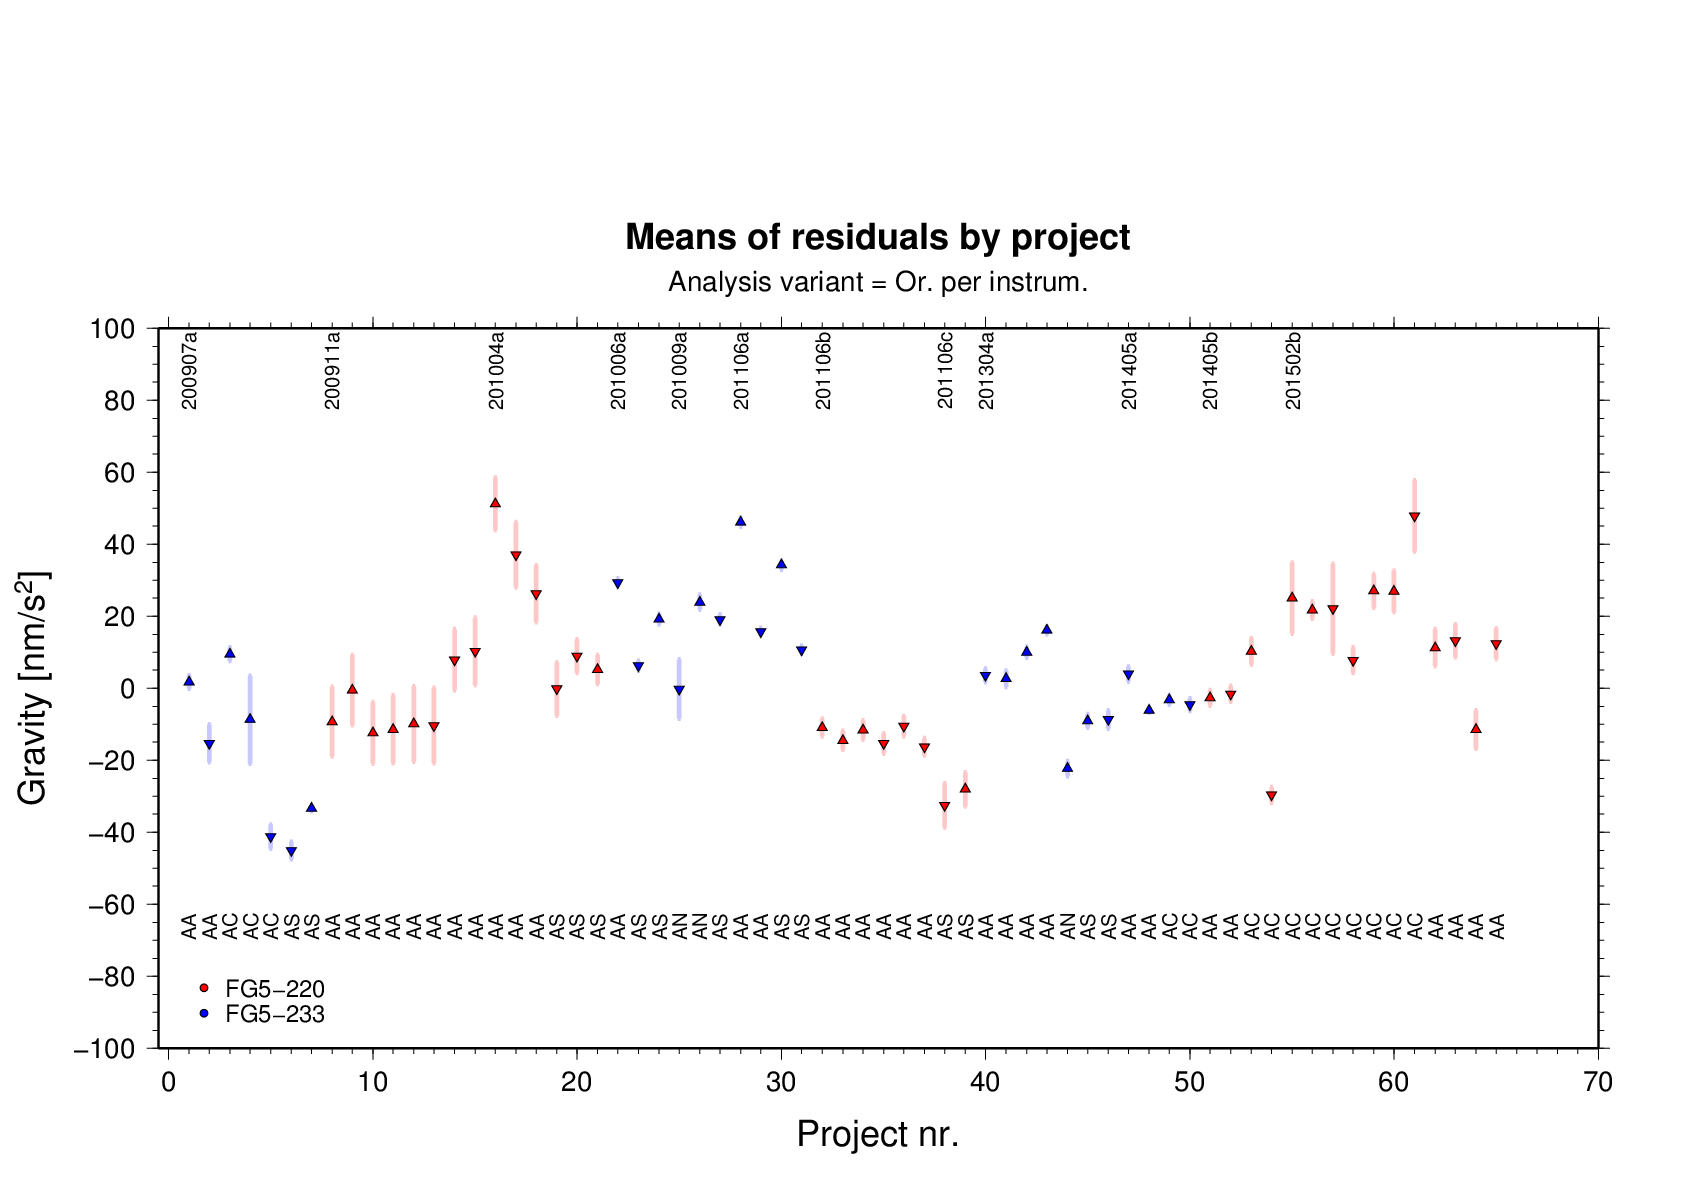
In order to zoom into the DC-offsets of the projects in the
super-campaign, else same data as in the
figures "scg-cal-merged" -O and -x, respectively
.bye
 /home/hgs/www/4me/ag-superc/scg-cal-merged-O.ph02.png
 /home/hgs/www/4me/ag-superc/scg-cal-merged-O.ra.png
 /home/hgs/www/4me/ag-superc/scg-cal-merged-x.ra.png
 /home/hgs/www/4me/ag-superc/tp-tbl-O.png
 /home/hgs/www/4me/ag-superc/tp-tbl-x.png